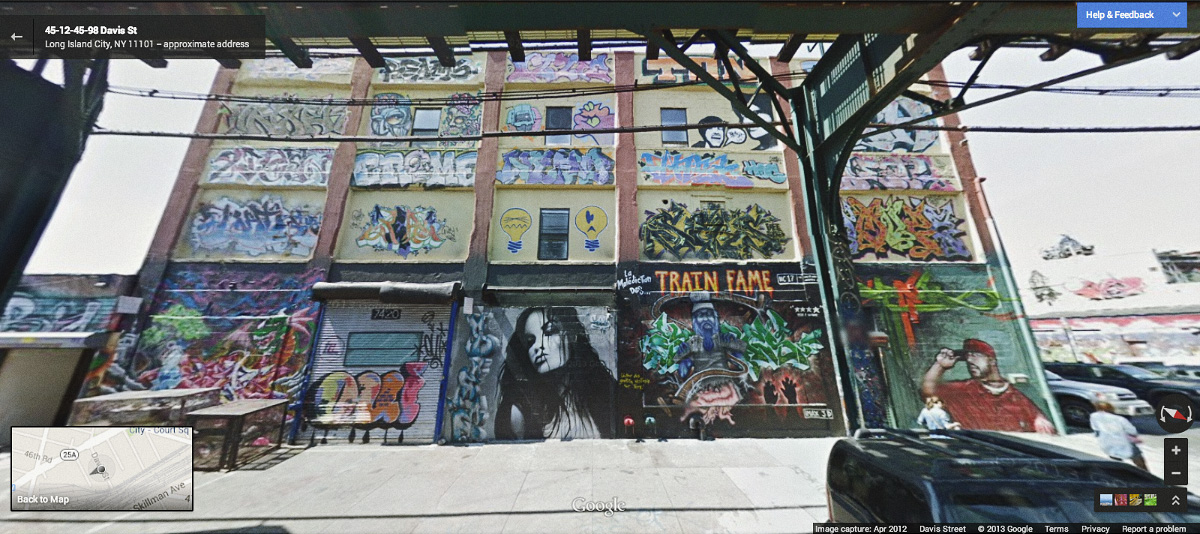
In 1995 Mayor Giuliani of New York City set up the Anti-Graffiti Task Force, a multi-agency initiative to combat the perceived problem of graffiti vandals in the city, in hopes that it would alleviate other more serious crimes as well. Nike Air More Uptempo new balance m998 This initiative came on the heels of the popularization of Broken Windows, a new social theory stating that maintaining and monitoring urban environments in a well-ordered condition may stop further vandalism and escalation into more serious crime.
air max 1 femme Many believe Giuliani’s efforts to be a success as graffiti presence, as well as crime rates, saw a serious drop in the late 1990’s.
Now, almost twenty years later, The Graffiti in NYC map by Mappler takes a look the status of graffiti in NYC today. Using 2010- 2011 data, instances of graffiti can be identified in three different colors; red, yellow, and green. Teddy Bridgewater Louisville Football Jerseys The green points on the map indicate graffiti that was reported and cleaned in less than 90 days. Yellow points were cleaned in more than 90 days and red points have not been cleaned at all. Women Air Jordan 3 Additionally using the task bar to the right of the map the user can make visible only locations that have been cleaned, or not cleaned. Air Jordan 5 Uomo
The task bar also allows for point specification by exact graffiti treatment. VALCLEAN2 CMF The user can simply click on the box located next to one of the five treatment options, ranging from properly cleaned to unspecified, and notice any visible patterns. This can be especially interesting when combining one of these specification with the heat map function also located on the task bar. nike damskie buty The heat map shows intensity of data points in a location rather than points individually. New Balance męskie
This function allows users to see exactly where clusters and patterns of intensity are most prevalent. Indiana Pacers Fjällräven Kånken Ryggsäck A few interesting patterns are worth mentioning. Pierre Garcon Redskins Jerseys For example, after specifying the map to show all graffiti locations left un-cleaned, the largest clusters or data points can be identified in areas of the Bronx, Queens, Brooklyn, and areas on the ends of Manhattan such as Harlem and the Village. However, when specifying the map to show graffiti locations that have been cleaned, the largest clusters occur throughout Manhattan Borough. Another interesting pattern can be seen when specifying the map to show only graffiti locations in which a cleaning crew was dispatched. For this specification nearly all points are located in Manhattan.
It is difficult to say what these, or other observation made from the map, can say about the evolution of graffiti cleanup in New York City since Mayor Giuliani’s crusade, but it does enable to user to observe interesting geographic patterns and initiate further research.

